Debugging functions, diagnostics and troubleshooting
10.3 Identification and maintenance data of the CPU
Write
You always require STEP 7 HW Config to write M data of the modules.
Data you can enter in the course of configuration , for example:
- Name of the AS (station name)
The station name is assigned in SIMATIC Manager when you create the station. The program generates a default station, for example, "SIMATIC 300(1)". You can always change this name.
- Data you can enter in STEP 7 HW Config, "CPU properties", "General" tab:
- Name of the module HW Config assigns a default name
- Plant ID of the module No default setting
- Location identifier (LID) of a module No default setting
Reading the I&M data in the user program
In order to read I&M data of the CPU in the user program, define the SSL ID and index and read the corresponding SSL by calling SFC51. The table below shows the SSL IDs and associated indexes.
SSL partial lists with I&M data
The I&M data are available in the SSL partial lists at the defined indexes.
Table 10- 1 SSL partial lists with I&M data
Debugging functions, diagnostics and troubleshooting
10.4 Overview: Debugging functions
| SSL-ID W#16#... | Index W#16# ... | Meaning |
|---|---|---|
| Component identification | ||
| 011C | Component identification | |
| 0001 | Name of the ASReturns the name of the AS (station name). | |
| 0002 | Name of the moduleReturns the name of the module. | |
| 0003 | Plant ID of the moduleReturns a unique identifier for the module. | |
| 000B | Location identifier (LID) of a moduleReturns the installation location of the module. |
Reference
For detailed information about the structure an content of the SSLs, refer to the System Software for S7-300/400, System and Standard Functions Manual and to the STEP 7 Online Help.
I&M data of connected I/O
Information about the I&M data of I/O connected to the CPU is available in the manuals of the corresponding I/O modules.
10.4 Overview: Debugging functions
Determining addressed nodes with "Node flashing test" (for CPUs >= V2.2.0)
To identify the addressed node, select PLC > Diagnostics/Setting > Node/Flashing Test in STEP 7.
A dialog appears in which you can set the flashing time and start the flashing test. The directly connected node can be identified by a flashing FORCE LED. The flashing test cannot be performed if the FORCING function is active.
Debugging functions, diagnostics and troubleshooting 10.4 Overview: Debugging functions
Debugging functions of the software: Monitoring and modifying variables, stepping mode
STEP 7 offers you the following testing functions you can also use for diagnostics:
- Monitoring and modifying variables Can be used for PG/PC monitoring of specific CPU or user program variables. You can also assign constant values to the variables.
- Testing with program status You can test your program by viewing the program status of each function (result of logical links, status bit) or the data of specific registers in real-time mode. For example, if you have selected the programming language LAD in STEP 7 for your presentation, the color of the symbol will indicate a closed switch or an active circuit.
Note The STEP 7 testing function with program status extends the CPU cycle time! In STEP 7, you can set up a maximum cycle time increase for CPUs < V2.8. To do this, set process mode and the desired maximum cycle increase for the CPU parameters in STEP 7, HW Config. On CPUs ≥ V2.8, it is not necessary to adjust the maximum cycle time increase, since the influence on the cycle time can usually be neglected on these CPUs when process mode is set.
- Stepping mode When testing in stepping mode, you can process your program instructions in sequence (= single-step) and set breakpoints. This is only possible in testing mode and not in process mode. However, for CPUs ≥V2.8, the debugging and process mode parameters are not configured in HW Config since the changeover is made directly in the LAD/FBD/STL editor under "Debug/Mode".
Note Number of blocks and breakpoints that can be monitored with status block
- For CPUs ≥V2.8 With these CPUs, you can monitor two blocks at the same time and set up to four breakpoints in stepping mode.
- All other CPUs of the range of validity With these CPUs, you can monitor one block set up to two breakpoints in stepping mode.
209
Debugging functions, diagnostics and troubleshooting 10.4 Overview: Debugging functions
Debugging functions of the software: Forcing variables
The Force function can be used to assign the variables of a user program or CPU (also: inputs and outputs) constant values which can not be overwritten by the user program.
For example, you can use it to jumper sensors or switch outputs permanently, irrespective of the user program.
DANGER This could result in severe injury or even death, and damage to property. Incorrect use of the Force function could result in death or severe injury, and damage to machinery or even the entire plant. Always follow the safety instructions in the STEP 7 manuals.
DANGER Forcing with S7-300 CPUs The force values in the process image of the inputs can be overwritten by write commands (such as T IB x, = I x.y, Copy with SFC, etc.) and by read I/O commands (such as L PIW x) in the user program, or by write PG/OP functions! Outputs initialized with forced values only return the forced value if not accessed by the user program via peripheral write instructions (TPQB x, for example) or by PG/OP write functions! Always ensure that forced values in the I/O process image cannot be overwritten by the user program or PG/OP functions!
With S7-300 CPUs, forcing corresponds to "cyclical controlling"
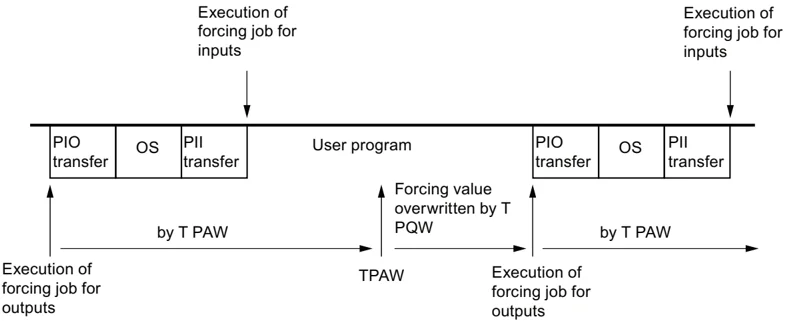
OS: Operating system processing Figure 10-1 Principle of forcing in S7-300 CPUs
210


Debugging functions, diagnostics and troubleshooting 10.4 Overview: Debugging functions
Differences between forcing and modifying variables
Table 10- 2 Differences between forcing and modifying variables
\begin{tabular}{|l|l|l|} \hline Characteristics/function & Forcing & Modifying variables \ \hline Memory bit (M) & - & Yes \ \hline Timers and counters (T, C) & - & Yes \ \hline Data blocks (DB) & - & Yes \ \hline Inputs and outputs (I, O) & Yes & Yes \ \hline Peripheral inputs (PI) & - & - \ \hline Peripheral outputs (PO) & - & Yes \ \hline User program can overwrite modify/ force values & Yes & Yes \ \hline Maximum number of force values & 10 & - \ \hline Power off retentive & Yes & No \ \hline \end{tabular}
Note Forcing process image partitions It is not possible to force inputs and outputs of the process image partition.
Reference Details on debugging functions of the software are available in the STEP 7 Online Help and in the Programming with STEP 7 Manual. For additional information on the cycle times, please refer to the "Cycle time" chapter.
211
Debugging functions, diagnostics and troubleshooting 10.5 Overview: Diagnostics
10.5 Overview: Diagnostics
Introduction Especially in the commissioning phase of a system, errors can occur. Tracking these errors might be a time-consuming effort, because errors can occur both on the hardware and software side. Here, the multitude of testing functions ensures commissioning without problems.
Note Errors during operation are almost always a result of faults or damage to the hardware.
Type of error Errors the S7 CPUs can recognize and to which you can react with the help of organization blocks (OBs) can be split into the following categories:
- Synchronous error: Errors you can relate to a specific point in the user program (error when accessing a peripheral module, for example).
- Asynchronous error: Errors you can not relate to a specific point in the user program (cycle time exceeded, module error, for example).
Troubleshooting Programming with foresight and, above all, knowledge and proper handling of diagnostic tools puts you into an advantageous position in error situations:
- You can reduce the effects of errors.
- It makes it easier for you to locate errors (by programming error OBs, for example).
- You can limit downtimes.
212
Debugging functions, diagnostics and troubleshooting 10.5 Overview: Diagnostics
Diagnostics with LED display
SIMATIC S7 hardware offers diagnostics with LEDs.
Table 10- 3 These LEDs are implemented in three colors:
Table 10- 4 Operation of the LEDs on PROFINET differs as follows compared to the table above:
Reference
Notes on diagnostics of I/O modules capable of diagnostics are found in the relevant Manual.
213
Debugging functions, diagnostics and troubleshooting 10.5 Overview: Diagnostics
Diagnostic buffer
If an error occurs, the CPU writes the cause of error to the diagnostic buffer. In STEP 7 you use the programming device to read the diagnostic buffer. This location holds error information in plain text.
Other modules capable of diagnostics can be equipped with their own diagnostic buffer. In STEP 7 (HW Config -> Diagnosing hardware), you can use the programming device to read this buffer.
Diagnosable modules without diagnostic buffer write their error information to the CPU's diagnostic buffer.
The CPU responds to an error or interrupt event (for example, a diagnostics interrupt of an I/O module) by going into STOP, or you can also choose to respond to these events in the user program by means of error or interrupt OBs. For a diagnostics interrupt you would call OB82.
Diagnostics of field devices on PROFINET
Additional information:
- PROFINET System Description System Manual.
- From PROFIBUS DP to PROFINET IO Programming Manual
The topics in the next chapters are focused on the diagnostics of local or distributed modules on PROFIBUS.
Diagnostics with system functions
If the following CPUs are used, we recommend that you use the more user-friendly SFB 54 RALRM (called in diagnostic OB82) to evaluate the diagnostics from centralized or distributed modules or DP slaves:
\begin{tabular}{|l|l|} \hline CPU & As of firmware version \ \hline 31xC, & V2.0.0 \ 312, 314, 315-2 DP & \ \hline 314C-2 PN/DP & V3.3 \ \hline 315-2 PN/DP & V2.3.0 \ \hline 317-2 DP & V2.1.0 \ \hline 317-2 PN/DP & V2.2.0 \ \hline 319-3 PN/DP & V2.4.0 \ \hline \end{tabular}
214
Debugging functions, diagnostics and troubleshooting
10.5 Overview: Diagnostics
Additional options for diagnostics with system functions are listed below:
- Using SFC 51 "RDSYSST" to read an SSL partial list or an extract thereof.
- Reading the diagnostic data (slave diagnostics) of a DP slave, using SFC 13 "DPNRM_DG"
Every DP slave provides slave diagnostic data according to EN 50 170 Volume 2, PROFIBUS. You can use SFC 13 "DPNRM_DG" to read these diagnostic data. Error information is stored in hex code. Refer to the relevant module manual for information on the meaning of the read code.
For example, the entry of the value 50H (= dual 0101 0000) in byte 7 of the slave diagnostics for the distributed I/O module ET 200B indicates a faulty fuse or missing load voltage in channel group 2 and 3.
- Reading data records by calling SFC52 "RDREC"
You can call SFC52 "RDREC" (read record) to read a specific data record from the addressed module. Data records 0 and 1 are especially suitable for reading diagnostic information from a diagnosable module.
Data record 0 contains 4 bytes of diagnostic data describing the current state of a signal module. Data record 1 contains the 4 bytes of diagnostic data also stored in data record 0, plus module-specific diagnostic data.
- Reading out the start information of the current OB, using the SFC 6 "RD_SINFO"
Error information is also found in the start information of the relevant error OB.
You can use SFC 6 "RD_SINFO" (read start information) to read the start information of the OB that was last called and not yet processed completely, and of the start-up OB that was last called.
- Triggering detection of the bus topology in a DP master system with the SFC103 "DP_TOPOL"
The diagnostics repeater improves the ability to locate faulty modules or an interruption on the DP cable when failures occur in ongoing operation. It operates in slave mode and is capable of logging faults based on the determination of the DP segment topology.
You can use SFC103 "DP_TOPOL" to trigger the identification of the bus topology of a DP master system by the diagnostic repeater. The SFC 103 is described in the corresponding STEP 7 Online Help and in the System Software S7300/400, System and Standard Functions Reference Manual. The diagnostic repeater is described in the manual Diagnostic Repeater for PROFIBUS DP.
215
Debugging functions, diagnostics and troubleshooting
10.6 Diagnostics functions available in STEP 7
Diagnostics using the "Diagnosing Hardware" function
Locate the cause of a module error by viewing the online information on the module. You can locate the cause of an error in the user program cycle with the help of the diagnostic buffer and of the stack content. You can also check whether a user program will run on a specific CPU.
Hardware diagnostics give you an overview of the PLC status. In an overview representation, a symbol can display the error status of every module. A double-click on the faulty module opens detailed error information. The scope of this information depends on the specific module. You can view the following information:
-
General information about the module (e.g. order number, version, designation) and the module status (e.g. malfunction).
-
Display of module errors (e.g. channel errors) on central I/O devices, PROFIBUS DP slaves, or PROFINET IO devices.
-
Display of messages from the diagnostic buffer.
-
Maintenance information: Maintenance demanded and maintenance required
-
The information also includes diagnostics data for the PROFINET interface.
For CPUs you can also view the following module status information:
-
Cause of an error in the user program cycle.
-
Indication of the cycle time (longest, shortest and last cycle).
-
Options and utilization of MPI communication.
-
Indication of performance data (number of possible I/O, memory bits, counters, timers and blocks).
-
Diagnostics (e.g. network connection, communication diagnostics and statistics) of the PROFINET interface and ports
For details on diagnostic functions in STEP 7 and on procedures, refer to the Programming with STEP 7 Manual and to the HW Config Online Help.
Debugging functions, diagnostics and troubleshooting 10.7 Network infrastructure diagnostics (SNMP)
10.7 Network infrastructure diagnostics (SNMP)
Availability
As an open standard, you can use any SNMP-based systems or software solutions for diagnostics in PROFINET.
Network diagnostics
SNMP (Simple Network Management Protocol) makes use of the connectionless UDP transport protocol. It consists of two network components, similar to the client/server model. The SNMP manager monitors the network nodes and the SNMP agents collect the various network-specific information in the individual network nodes and stores it in a structured form in the MIB (Management Information Base). This information allows a network management system to run detailed network diagnostics.
MIB
An MIB (Management Information Base) is a data base of a device. SNMP clients access this data base in the device. The S7 device family supports, among others, the following standard MIBs:
- MIB II, standardized in the RFC 1213
- LLDP MIB, standardized in the international standard IEE 802.1AB
- LLDP PNIO-MIB, standardized in the international IEC standard 61158-6-10
Detecting the network topology
LLDP (Link Layer Discovery Protocol) is a protocol that is used to detect the closest neighbors. It enables a device to send information about itself and to save information received from neighboring devices in the LLDP MIB. This information can be looked up via the SNMP. This information allows a network management system to determine the network topology.
Integrating HMI devices via the SNMP OPC server
Configuration of the OPC server is integrated in the STEP 7 hardware configuration application. The communication with the OPC server is carried out without an S7 connection. You therefore do not need to configure S7 connections.
Stations that have already been configured in the STEP 7 project can be transferred directly. As an alternative to STEP 7, the configuration can also be run with the NCM PC (included on the SIMATIC NET CD) or can be determined automatically and transferred to the project configuration.
217
Debugging functions, diagnostics and troubleshooting 10.7 Network infrastructure diagnostics (SNMP)
Use of SNMP in the SIMATIC NET environment
SNMP-compliant devices from the SIMATIC NET family can be monitored and operated via a conventional standard Internet browser.
The management system known as web-based management offers a range of device-specific information (network statistics, status of redundant supply, for example).
Diagnostics with the SIMATIC NET SNMP OPC server
The SNMP-OPC-Server software facilitates diagnostics and parameter assignment actions on any SNMP device, even including HMI devices which cannot read SNMP variables from other devices.
The OPC server uses the SNMP protocol to exchange data with these devices.
All information can be integrated into OPC compatible systems such as the HMI system WinCC. This enables process and network diagnostics to be combined in the HMI system.
Uses of SNMP
SNMP can be used as follows:
- By users, to integrate network diagnostics into a central HMI/SCADA system using the SNMP OPC server
- By the IT administration of machines and plant owners to monitor their Industrial Ethernet network using standard network management systems.
- By the IT administration, to primarily monitor the office network, but often also the automation network using standard network management systems (for example, HP Open view).
Additional information
Information relating to SNMP in the network management standardization group can be found at Internet (http://www.snmp.org/).
Additional information on SNMP can be found on the Internet (http://www.profibus.com).
Additional information on SNMP OPC servers can be found on the Internet (http://www.automation.siemens.com/net/html_76/produkte/040_snmp.htm).
218
Debugging functions, diagnostics and troubleshooting
10.8 Diagnostics using status and error LEDs
10.8 Diagnostics using status and error LEDs
10.8.1 Introduction
Diagnostics with LEDs is an initial tool for error localization. Usually, you evaluate the diagnostic buffer for further error localization.
The buffer contains plain text information on the error that has occurred. For example, you will find the number of the appropriate error OB here. You can prevent the CPU from going into STOP mode by generating this OB and downloading it to the CPU.
10.8.2 Status and error displays of all CPUs
Status and error displays
219
Debugging functions, diagnostics and troubleshooting
10.8 Diagnostics using status and error LEDs
| LED | Meaning | |||||
|---|---|---|---|---|---|---|
| SF | MAINT | DC5V | FRCE | RUN | STOP | |
| X | On | X | X | X | X | For IRT mode of a PROFINET IO system:• Failure of the sync master in a sync domain• Synchronization loss at the own station (for example, due to sync master failure)• Synchronization loss at a connected PROFINET IO device (for example, due to sync master failure)Other PROFINET IO maintenance requirements (for example, excess attenuation of fiber-optic cables)For media redundancy (MRP):• Missing or interrupted connection between ring ports• Failure of an MRP client on the ring• If several redundancy managers exist |
| X | X | X | On | X | X | You have enabled the Force function.For additional information, refer to the Programming with STEP 7 manual. |
| X | X | X | Flashes (2 Hz) | X | X | Node flashing test was activated. |
| Flashes | X | Flashes | Flashes | Flashes | Flashes | Your CPU has an internal system error. The procedure is as follows:1. Set the mode selector switch to STOP.2. Perform POWER ON/OFF.3. Read the diagnostics buffer with STEP 7.4. Read out the service data for CPUs ≥ V2.8 (see chapter "Reading/saving service data (Page 205)")5. Contact your local SIEMENS partner. |
| Flashes (2 Hz) | Off | Off | Off | Off | Off | CPU without valid firmwareRemedy: Update the firmware via Micro Memory Card, see chapter Firmware update using a Micro Memory Card (Page 192) |
X: This status is irrelevant to the current CPU function.
Reference
- Details on the OBs and on SFCs required for their evaluation can be found in the STEP 7 Online Help and in the Manual System Software for S7-300/400 - System and Standard Functions.
10.8.3 Evaluating the SF LED in the case of software errors
Evaluation of the SF LED (Software error)
| Possible problem | CPU reaction | Possible remedies |
|---|---|---|
| TOD interrupt is enabled and triggered. However, the appropriate OB is not loaded. (Software/ parameter assignment error) | Call of OB85. CPU goes into STOP if OB85 is not loaded. | Load OB10 (OB number is apparent from the diagnostic buffer). |
| Start time of the enabled TOD interrupt was jumped, e.g. by advancing the internal clock. | Call of OB80. goes into STOP if OB80 is not loaded | Disable the TOD interrupt before you set the time-of-day with SFC 29. |
| Delay interrupt triggered by SFC 32. However, the appropriate OB is not loaded. (Software/parameter assignment error) | Call of OB85. CPU goes into STOP if OB85 is not loaded. | Load OB 20 or 21 (CPU 317 only) (the OB number can be viewed in the diagnostic buffer). |
| Process interrupt is enabled and triggered. However, the appropriate OB is not loaded. (Software/ parameter assignment error) | Call of OB85. CPU goes into STOP if OB85 is not loaded. | Load OB40 (OB number is apparent from the diagnostic buffer). |
| Status interrupt is generated, but the appropriate OB55 is not loaded. | Call of OB85. CPU goes into STOP if OB85 is not loaded. | Load OB55 |
| Update alarm is generated, but the appropriate OB 56 is not loaded. | Call of OB85. CPU goes to STOP if OB 85 is not loaded. | Load OB56 |
| Vendor-specific alarm is generated, but the appropriate OB57 is not loaded. | Call of OB85. CPU goes into STOP if OB85 is not loaded. | Load OB57 |
| Access to missing or defective module upon updating the process image (software or hardware error) | Call OB 85 (depending on the configuration in HW Config). CPU goes into STOP if OB 85 is not loaded. | Load OB85, the start information of the OB contains the address of the relevant module. Replace the relevant module or eliminate the program error. |
| The cycle time was exceeded. Probably too many interrupt OBs called simultaneously. | Call of OB80. CPU goes into STOP if OB80 is not loaded. The CPU switches to STOP despite loaded OB80 if the doubled cycle time was exceeded without retriggering cycle time. | Extension of the cycle time (STEP 7 – Hardware configuration), changing the program structure. Remedy: Retrigger cycle time monitoring by calling SFC 43 |
| Programming error• Block not loaded• Wrong block number• Wrong timer/counter number• Read/write access to wrong area• etc. | Calls OB121. CPU does not STOP if OB121 is loaded. | Eliminate the programming error. The STEP 7 testing function helps you to locate the error. |
| I/O access errorsAn error has occurred when module data was accessed | Calls OB122. CPU does not STOP if OB122 is loaded. | Check the addressing of the modules in HW Config or whether a module, a DP slave, or a PROFINET IO device has failed. |
| Global data communication error, such as insufficient length of the DB for global data communication. | Call of OB87. CPU goes into STOP if OB87 is not loaded. | Check global data communication in STEP 7. If required, correct the DB size. |
Operating Instructions, □□/□□□□, A5E00105492-12 221
Debugging functions, diagnostics and troubleshooting 10.8 Diagnostics using status and error LEDs
Tip:
- You can use SFC 39 to disable all interrupts and asynchronous error events.
Note The shorter the selected cyclic interrupt period, the more likely it is that cyclic interrupt errors will occur. You must take into account the operating system times of the CPU in question, the user program runtime and extension of the cycle time by active PG functions, for example.
Reference Details on the OBs and on the SFCs required for their evaluation are available in the STEP 7 Online Help and in the System Software for S7-300/400 - System and Standard Functions Reference Manual.
10.8.4 Evaluating the SF LED in the case of hardware errors
Evaluation of the SF LED (Hardware error)
Debugging functions, diagnostics and troubleshooting 10.8 Diagnostics using status and error LEDs
| Possible problem | CPU reaction | Possible remedies |
|---|---|---|
| Faulty SIMATIC MMC. | The CPU goes into STOP mode and requests memory reset. | Replace the SIMATIC MMC, reset CPU memory, transfer the program again, then set the CPU to RUN mode. |
| A port interconnection was configured, however, a partner is not available at the port, or an incorrect partner was detected. | A missing or incorrect partner device on the port of the PROFINET interface leads to a corresponding entry in the diagnostics buffer and message in the communication diagnostics of the port.If the call of an OB 82 for communication interrupts of the PROFINET interface is enabled in in HW Config, then OB 82 will be called if a relevant event occurs while the IM is in RUN mode. | Set up a connection to the correct partner. |
| The CPU is operated as intelligent device on an IO controller (which can also be a CPU) on a PROFINET IO subnet.One of the two communication partners goes into STOP mode (or is in STOP mode). | IO controller in RUN and intelligent device in STOP mode:• Direct I/O access to inputs/outputs of the application transfer areas to intelligent devices leads to access errors (call of OB 122) in the IO controller.• If the application transfer areas are in the process image and you configured a call of OB 85 for process image transfer errors in the parameters, this OB 85 will be called.IO controller in STOP and intelligent device in RUN mode:• Direct I/O access to inputs/outputs of the user transfer areas to the controller leads to access errors (call of OB 122) in the intelligent device.• If the user transfer areas are in the process image and you configured a call of OB 85 for process image transfer errors in the parameters, this OB 85 will be called. | Load OB 85 or OB 122 |
Reference
Details on the OBs and on the SFCs required for their evaluation are available in the STEP 7 Online Help and in the System Software for S7-300/400 - System and Standard Functions Reference Manual.
223
Debugging functions, diagnostics and troubleshooting 10.8 Diagnostics using status and error LEDs
10.8.5 Status and error indicators: CPUs with DP interface
Description of the BF, BF1 and BF2 LEDs
Table 10- 5 LEDs BF, BF1 and BF2
\begin{tabular}{|l|l|l|l|l|l|} \hline \multicolumn{5}{|l|}{LED} & Meaning \ \hline SF & 5 VDC & BF & BF1 & BF2 & \ \hline On & On & On/flashe s & - & - & PROFIBUS DP interface error. Remedy: See the table below \ \hline On & On & - & On/flashe s & X & Error at the first PROFIBUS DP interface of CPU 317 or CPU 319-3 PN/DP. Remedy: See the table below. \ \hline On & On & - & X & On/flashe s & Error at the second PROFIBUS DP interface of the CPU 317-2 DP or CPU 319-3 PN/DP. Remedy: See the tables below \ \hline \end{tabular}
Explanation of the State X: The LED can assume the On or Off state. This status, however, is irrelevant for the current CPU function.
Table 10- 6 BF LED is lit
\begin{tabular}{|p{0.3\textwidth}|p{0.3\textwidth}|p{0.3\textwidth}|} \hline Possible problem & CPU reaction & Possible remedies \ \hline • Bus fault (hardware fault). & Call of OB 86, if the CPU is in RUN mode and communication between the DP master and DP slave functioned properly before the error occurred. CPU switches to STOP if OB 86 is not loaded. & • Check the bus cable for short-circuit or breaks. \ \hline • DP interface error. & & • Analyze the diagnostic data. Edit the configuration. \ \hline • Different transmission rates in multiple DP master mode. & & \ \hline • If the DP slave / master interface is active: short-circuit on the bus. & & \ \hline • With passive DP slave interface: transmission rate search, i.e. there are no other active nodes on the bus (a master, for example) & & \ \hline \end{tabular}
224